Views:

Gantt View
A Gantt chart by operations and tasks of your production schedule.


List View
A list view by operations and tasks of your production schedule


Caching
The data appearing on this report is subject to the caching interval settings in Advanced Settings, General.  To see up to date data more frequently, lower the caching interval.  Be careful setting the caching values as very low settings can decrease the applications performance. 


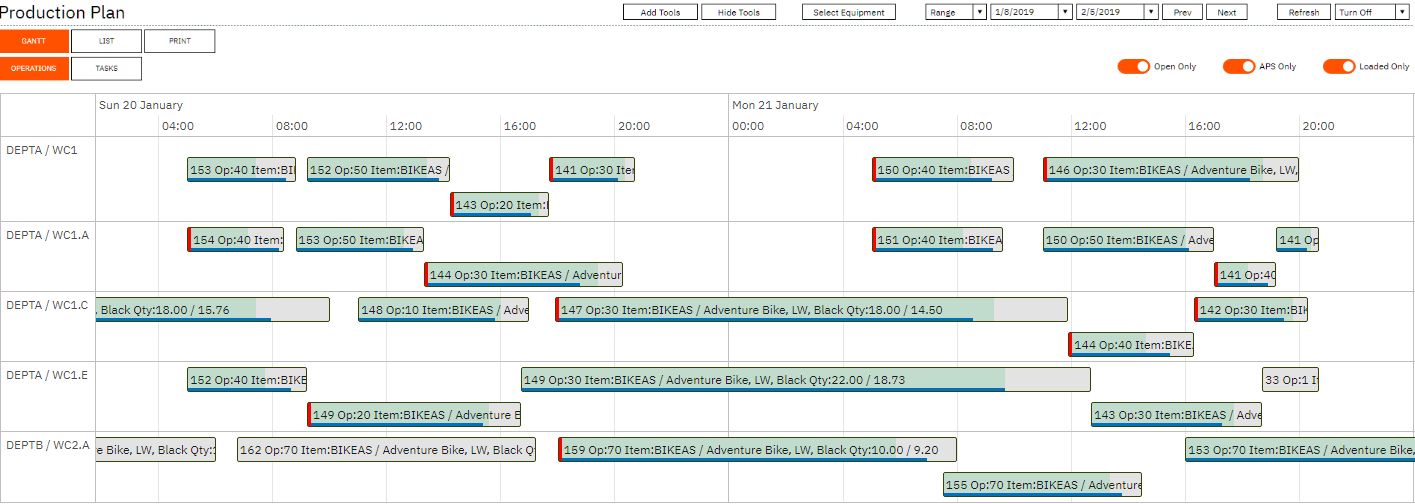
The production plan is an online view of orders that have been scheduled in Visual APS, providing visibility of the plan for non APS users.  The production plan has a Gantt view for both operations and tasks and can be viewed in list format.  The print plan option provides a shop packet style report to be printed which supports barcodes.   


Progress indicators are updated in real-time, providing excellent visibility of work in progress.


Progress Indicators:

 
  • GREEN centre – labour reported
  • RED centre – labour hours exceeded
  • BLUE bar – quantity reported
  • RED bar – quantity exceeded
  • RED vertical bar – issues
 

Double clicking on the order on the production plan, will show the job card.

To sort the production plan by date, use the List View and sort by start date  Sorting by start date provides a simple job order list view of the entire schedule and what should be being worked on.  You can of course filter and customise this list to get to the information you want.
 

To open the production plan from Visual APS:

 
  1. Select the Reports Menu
  2. Select Production Plan

If the production plan is greyed out, the MOM integration settings have not been configured.

To set the MOM integration settings:

 
  1. Select the File Menu
  2. Select Company Settings
  3. Select the General Tab
  4. Enter the URL of the MOM Site in the MOM Integration field


To open the production plan from LYNQ

 
  1. Select Production Plan from the menu section Dispatching


Functional Area: Dispatching