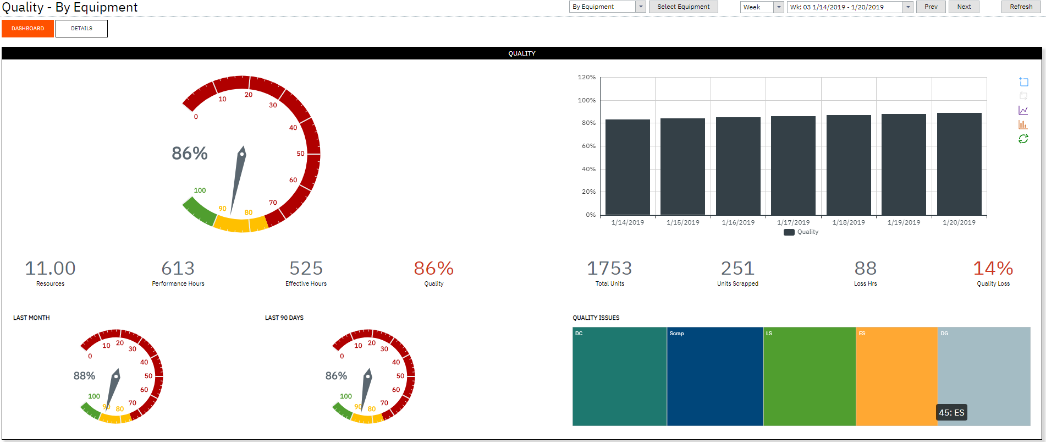
Views:

Performance Hours
The calculated hours based on the total quantity produced (good and bad) for the selected resources within the time period


Effective Hours
The calculated hours based on the good quantity produced for the selected resources within the time period


Quality
The ratio shown as a percentage of the effective hours compared with the performance hours


Total Units
The total number of units actually produced (good and bad) by the selected resources within the time period


Units Scrapped
The total number of bad products produced by the selected resources within the time period


Loss hours
The difference between calculated performance and calculated effective hours


Quality Loss
The ratio shown as a percentage of hours lost in the production of bad product

The Quality Report provides detailed analysis of the quality output from employees or equipment with comparisons to last month and/or quarter to understand trends. Use this to gain insight by resource of where product quality issues have affected your output.


To open Quality:


  1. Select Quality in Performance Analysis


Related Articles (1)