|
Six Big Loss
LYNQ supports
continuous improvement by providing Six Big Loss, Loading and other analysis. It not only provides the key performance indicators (KPI’s), but also provides the metrics and the means of measurement, out of the box
TEEP
Showing both OEE and TEEP key performance indicators
Products
Views showing products, parts to produce, parts count and % complete.
Available Hours
The total number of actual productive hours for the selected resources and time period
Performance Hours
The calculated hours based on the total quantity produced (good and bad)
Effective Hours
The calculated hours based on only the good quantity produced
Lost Hours
The total number of hours lost in producing only good product when compared with scheduled (planned) hours
|
LYNQ supports Six Sigma methodologies such as DMAIC (Define, Measure, Analyse, Improve, and Control) by providing the definition of what to measure, the measurement itself and the analysis so that loss can be targeted, reduced and/or eliminated. This helps to drive continuous improvement within your environment, bringing manufacturing processes under control with greater efficiency and productivity as a result.
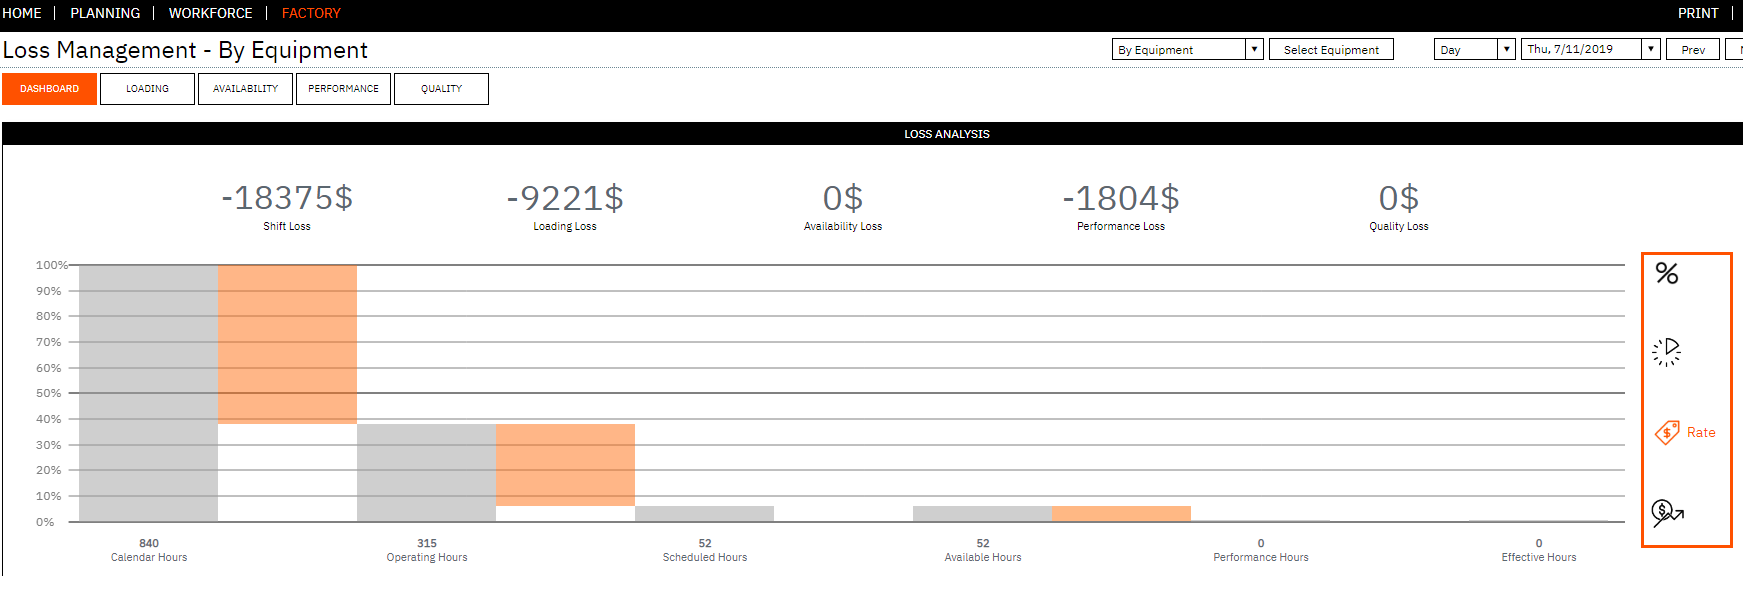
The Loss Management report has been enhanced to include four financial loss visualisations:
• %
• Hour
• Rate
• Revenue
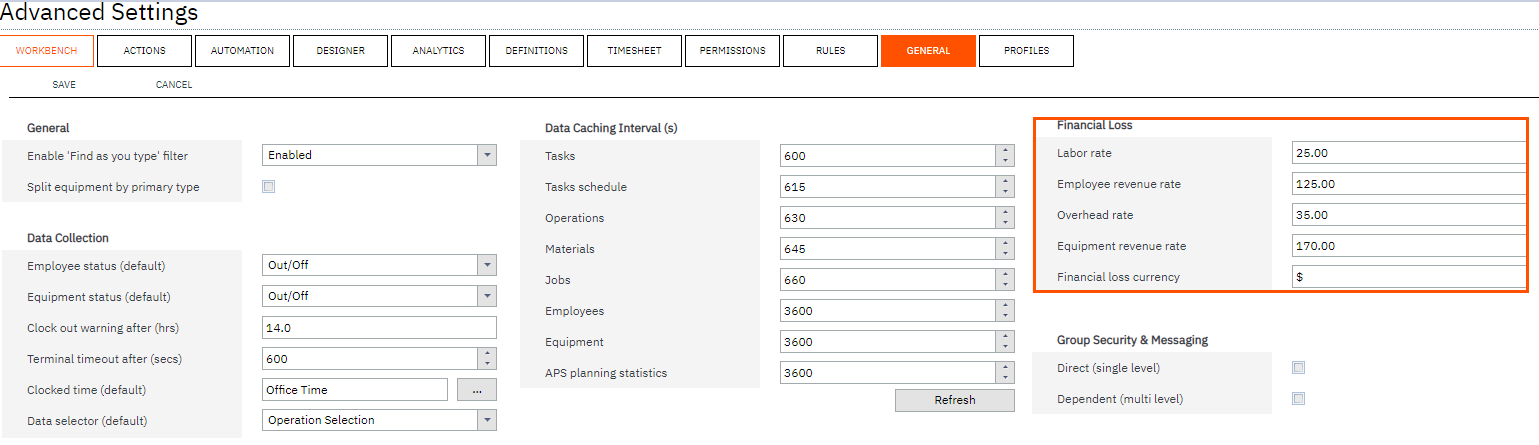
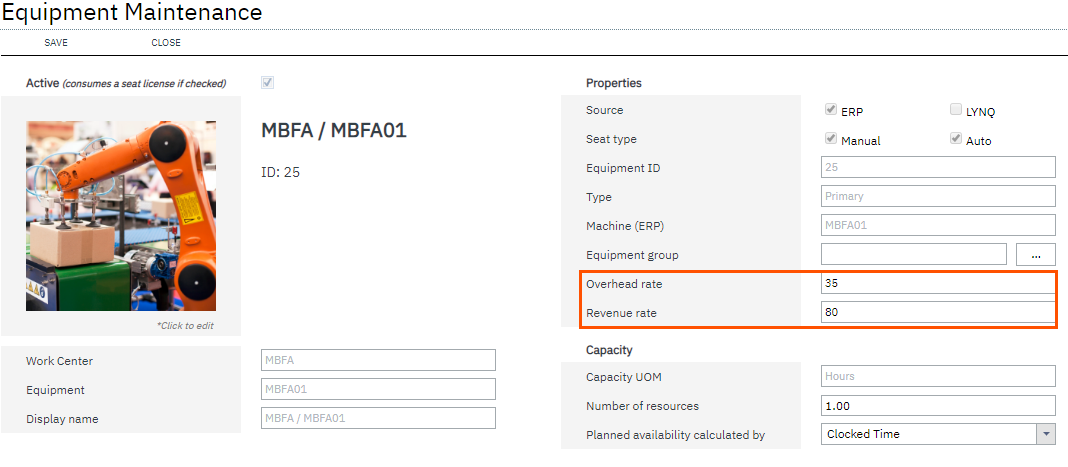
A default system wide labour rate, employee revenue rate, overhead rate, equipment revenue rate can be setup in Advanced Settings/General. Rates can also be setup at the seat level in seat maintenance which will override the system wide settings.
Financial settings in Advanced Settings:
Rate settings in Equipment Maintenance
The Loss Management Dashboard displays realisation of loss across your manufacturing operations with every loss identified, classified (Six Big Loss) and quantified to allow for counter measures to be applied and continuous improvement to be made.
Different Visualisations of Loss Management
|
Visualisation
|
|
Meaning
|
|
Loss Management by %
|
Shows the loss in percentage of hours for your manufacturing operation
|
|
Loss Management by Hour
|
Shows the loss in hours for your manufacturing operation
|
|
Loss Management by Rate
|
Shows the loss at cost value for your manufacturing operation
|
|
Loss Management by Revenue
|
Shows the loss at revenue value for your manufacturing operation
|
|

